Assignment 2 Exploratory Data Analysis

Brandon Meehanbmeehan3@mit.edu

Subtheme: Housing for the Rich

Overall Analysis Questions

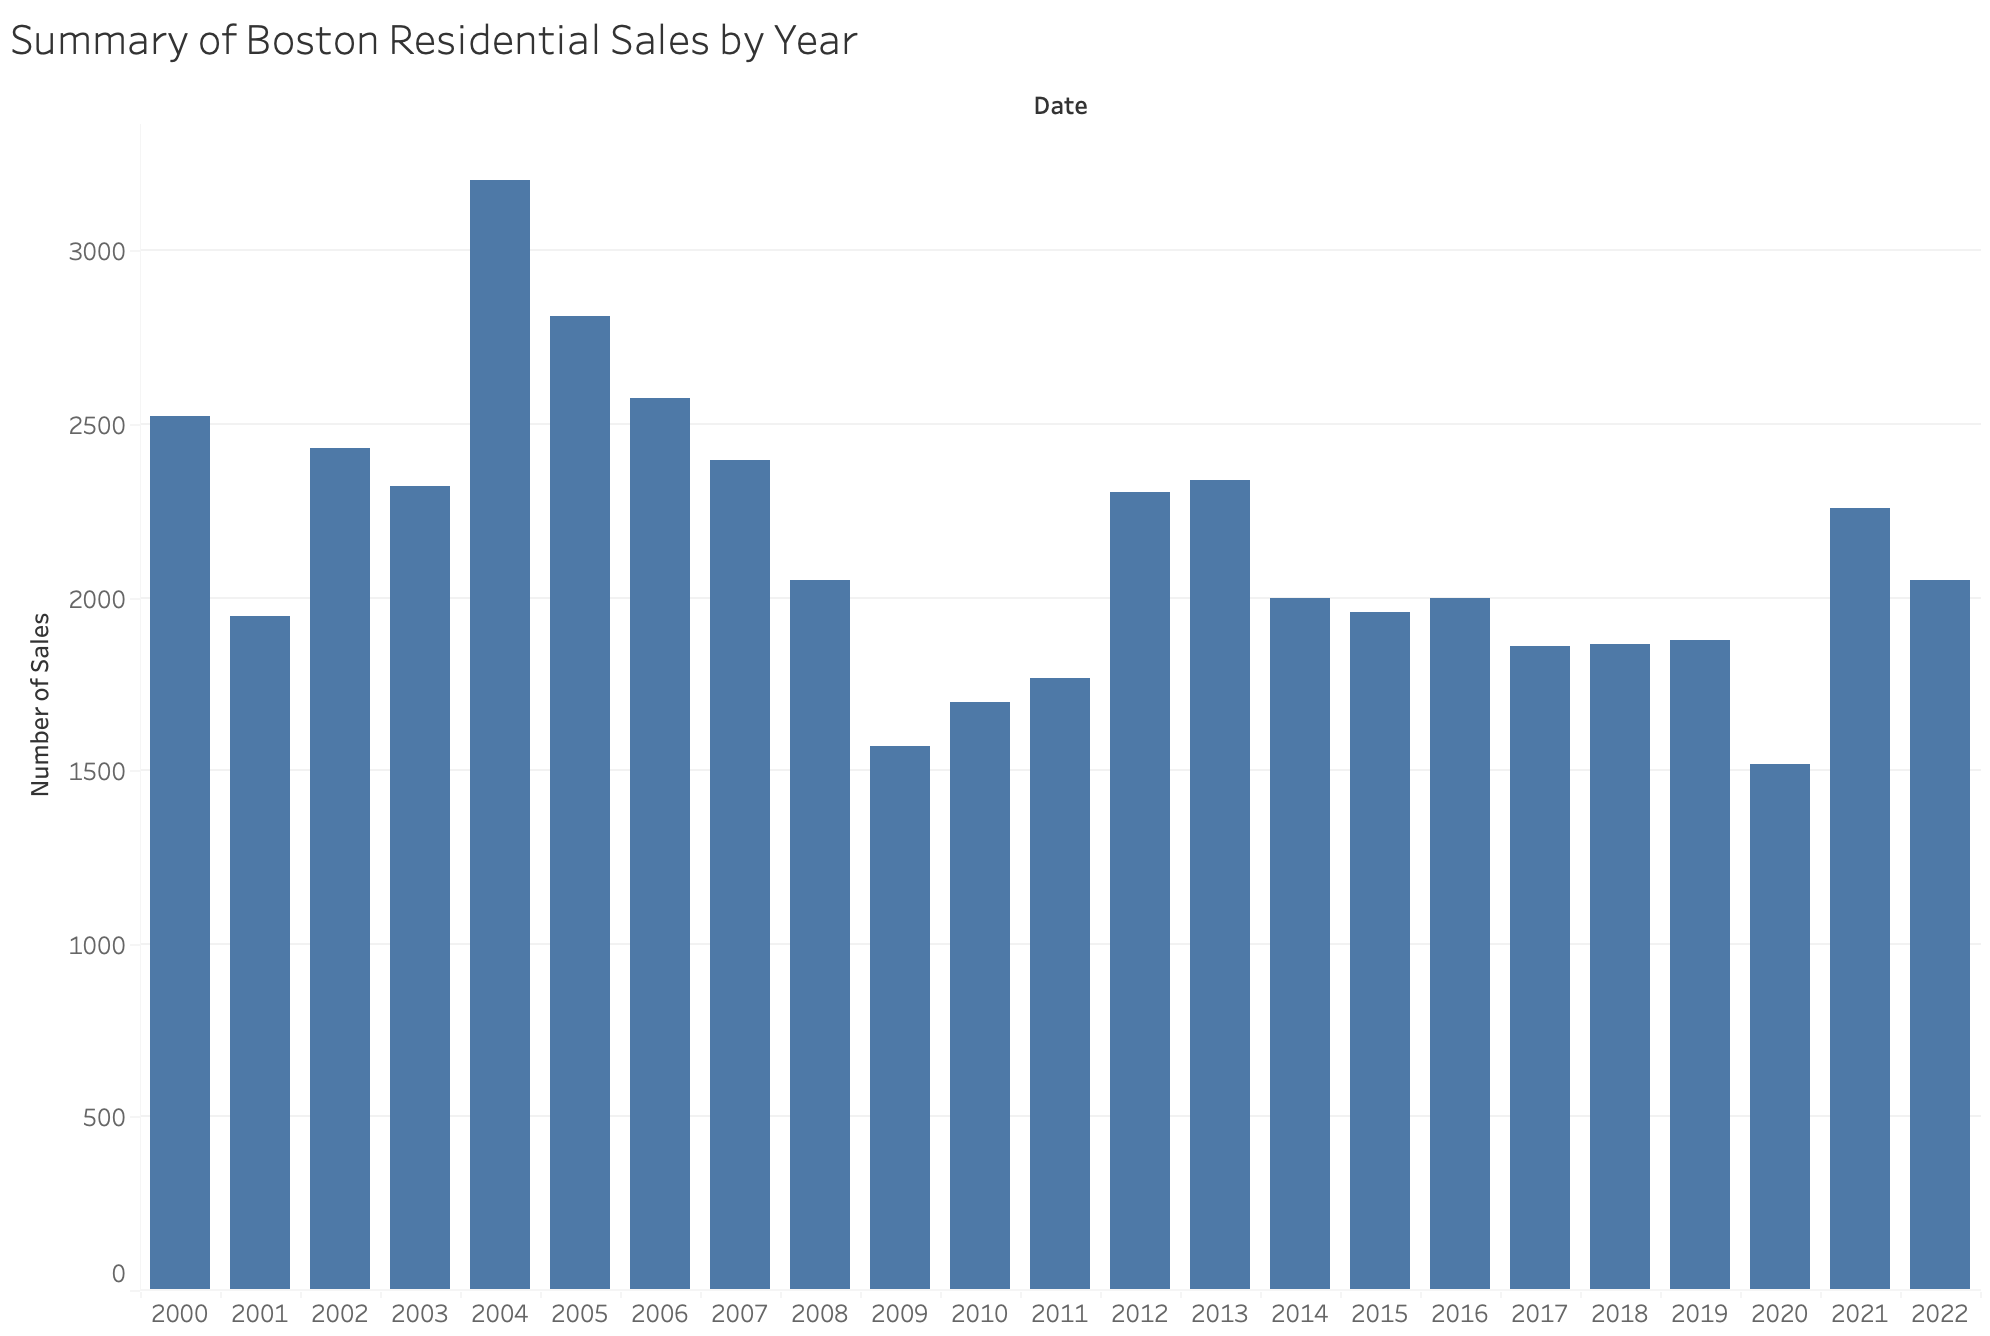
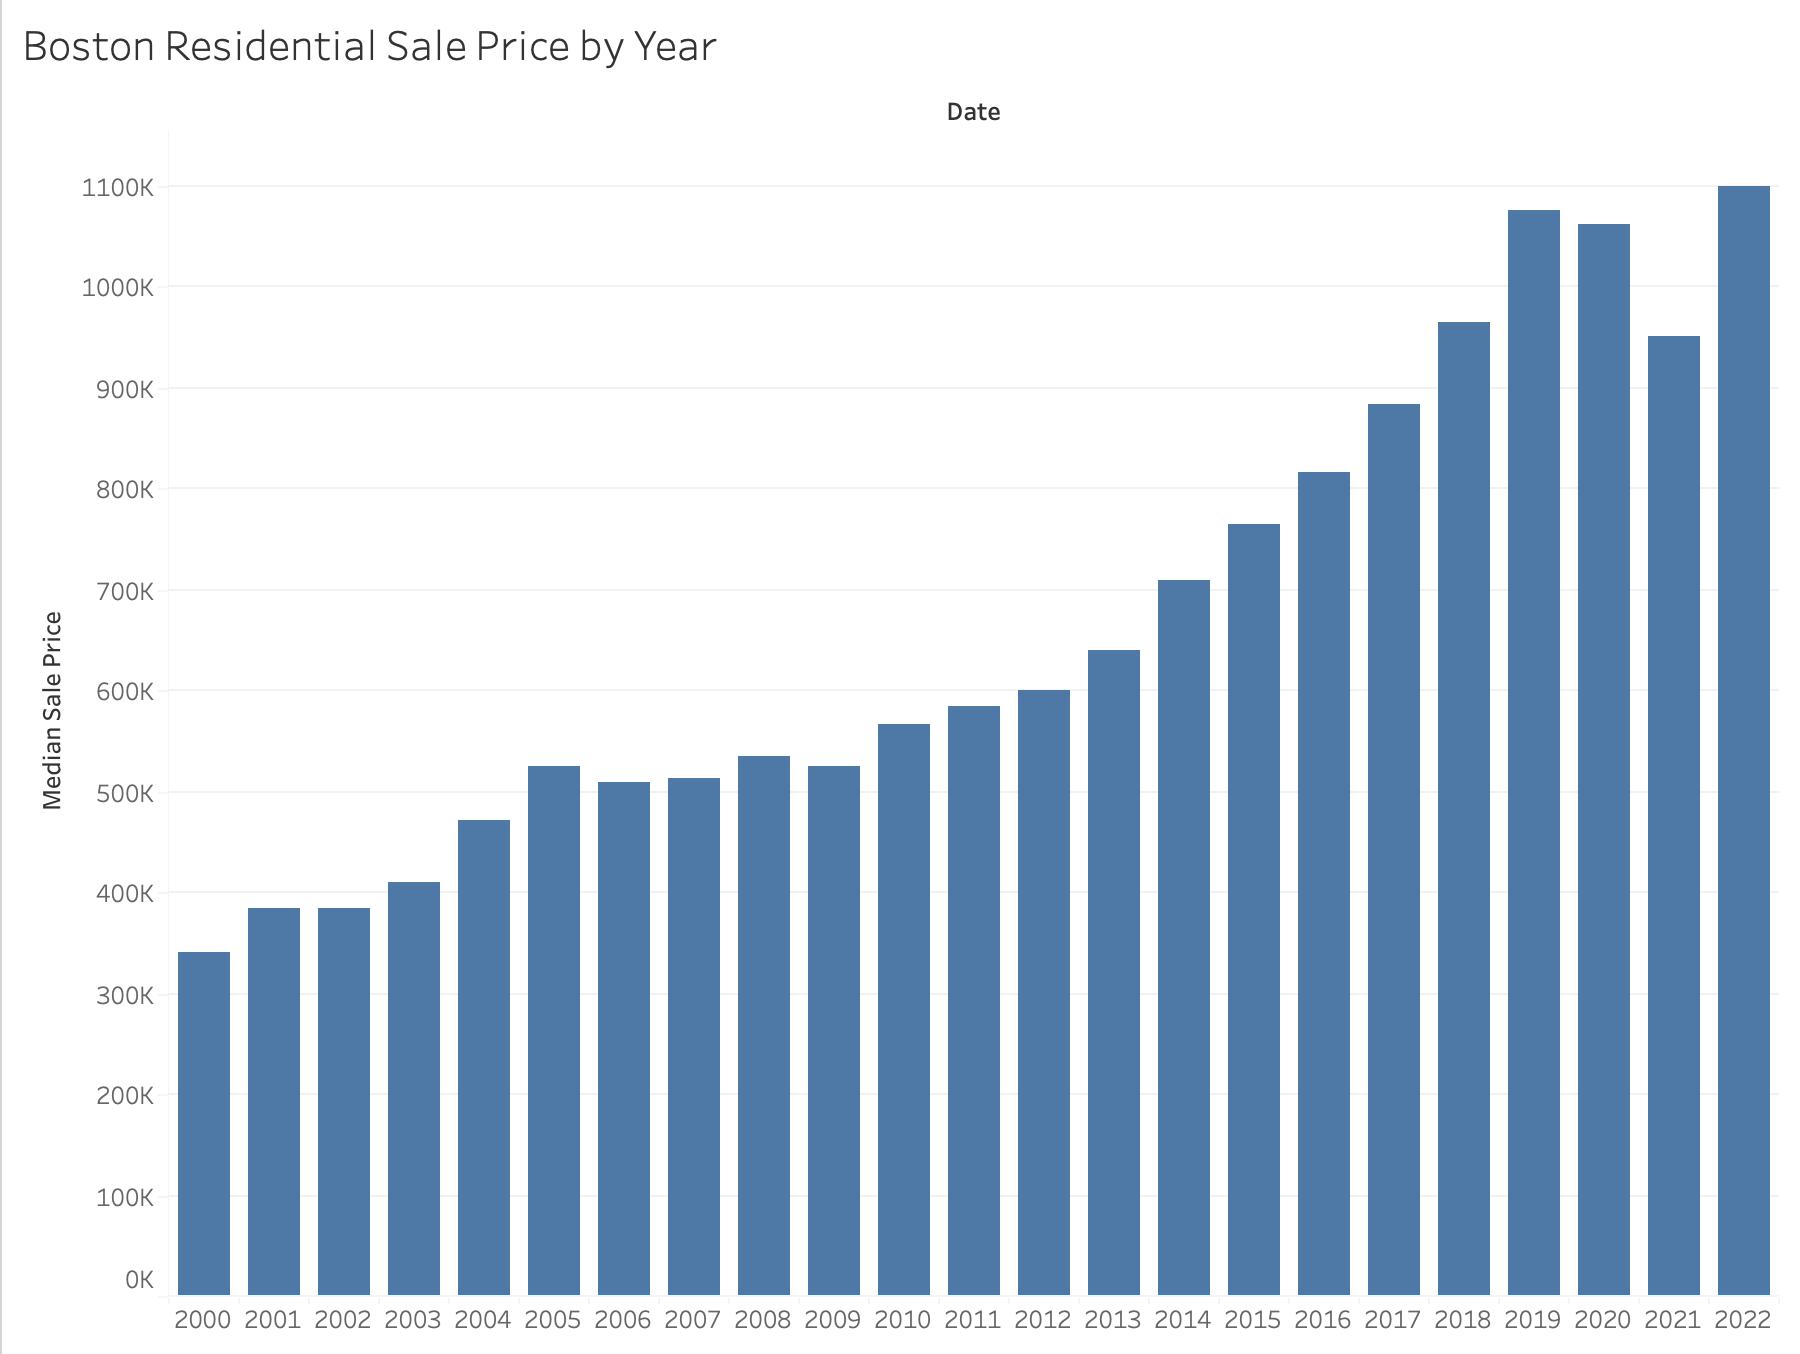
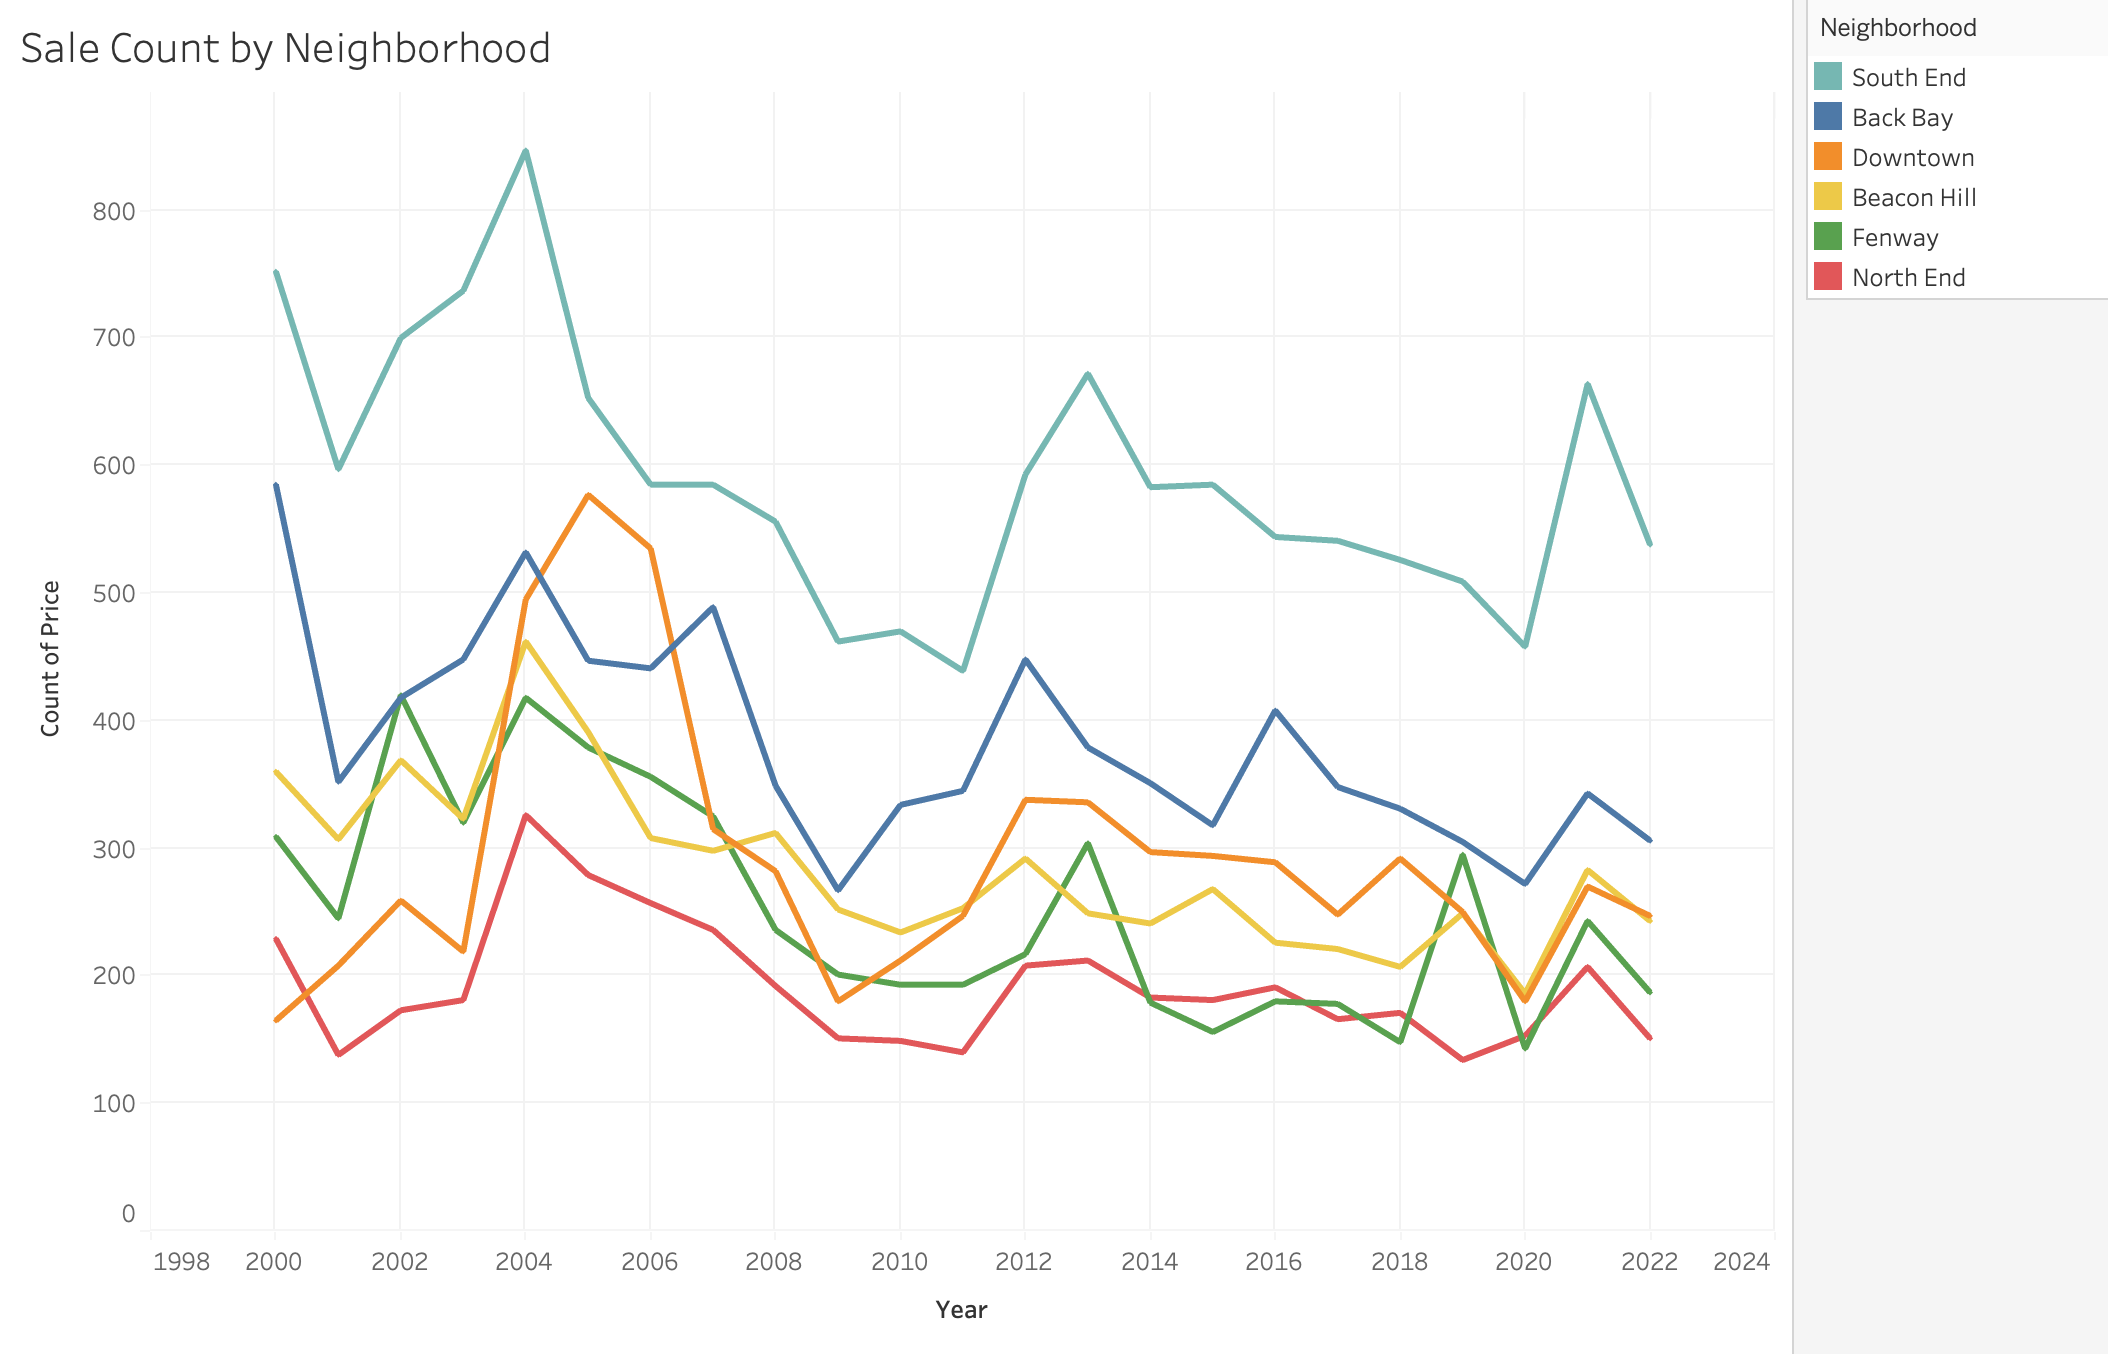
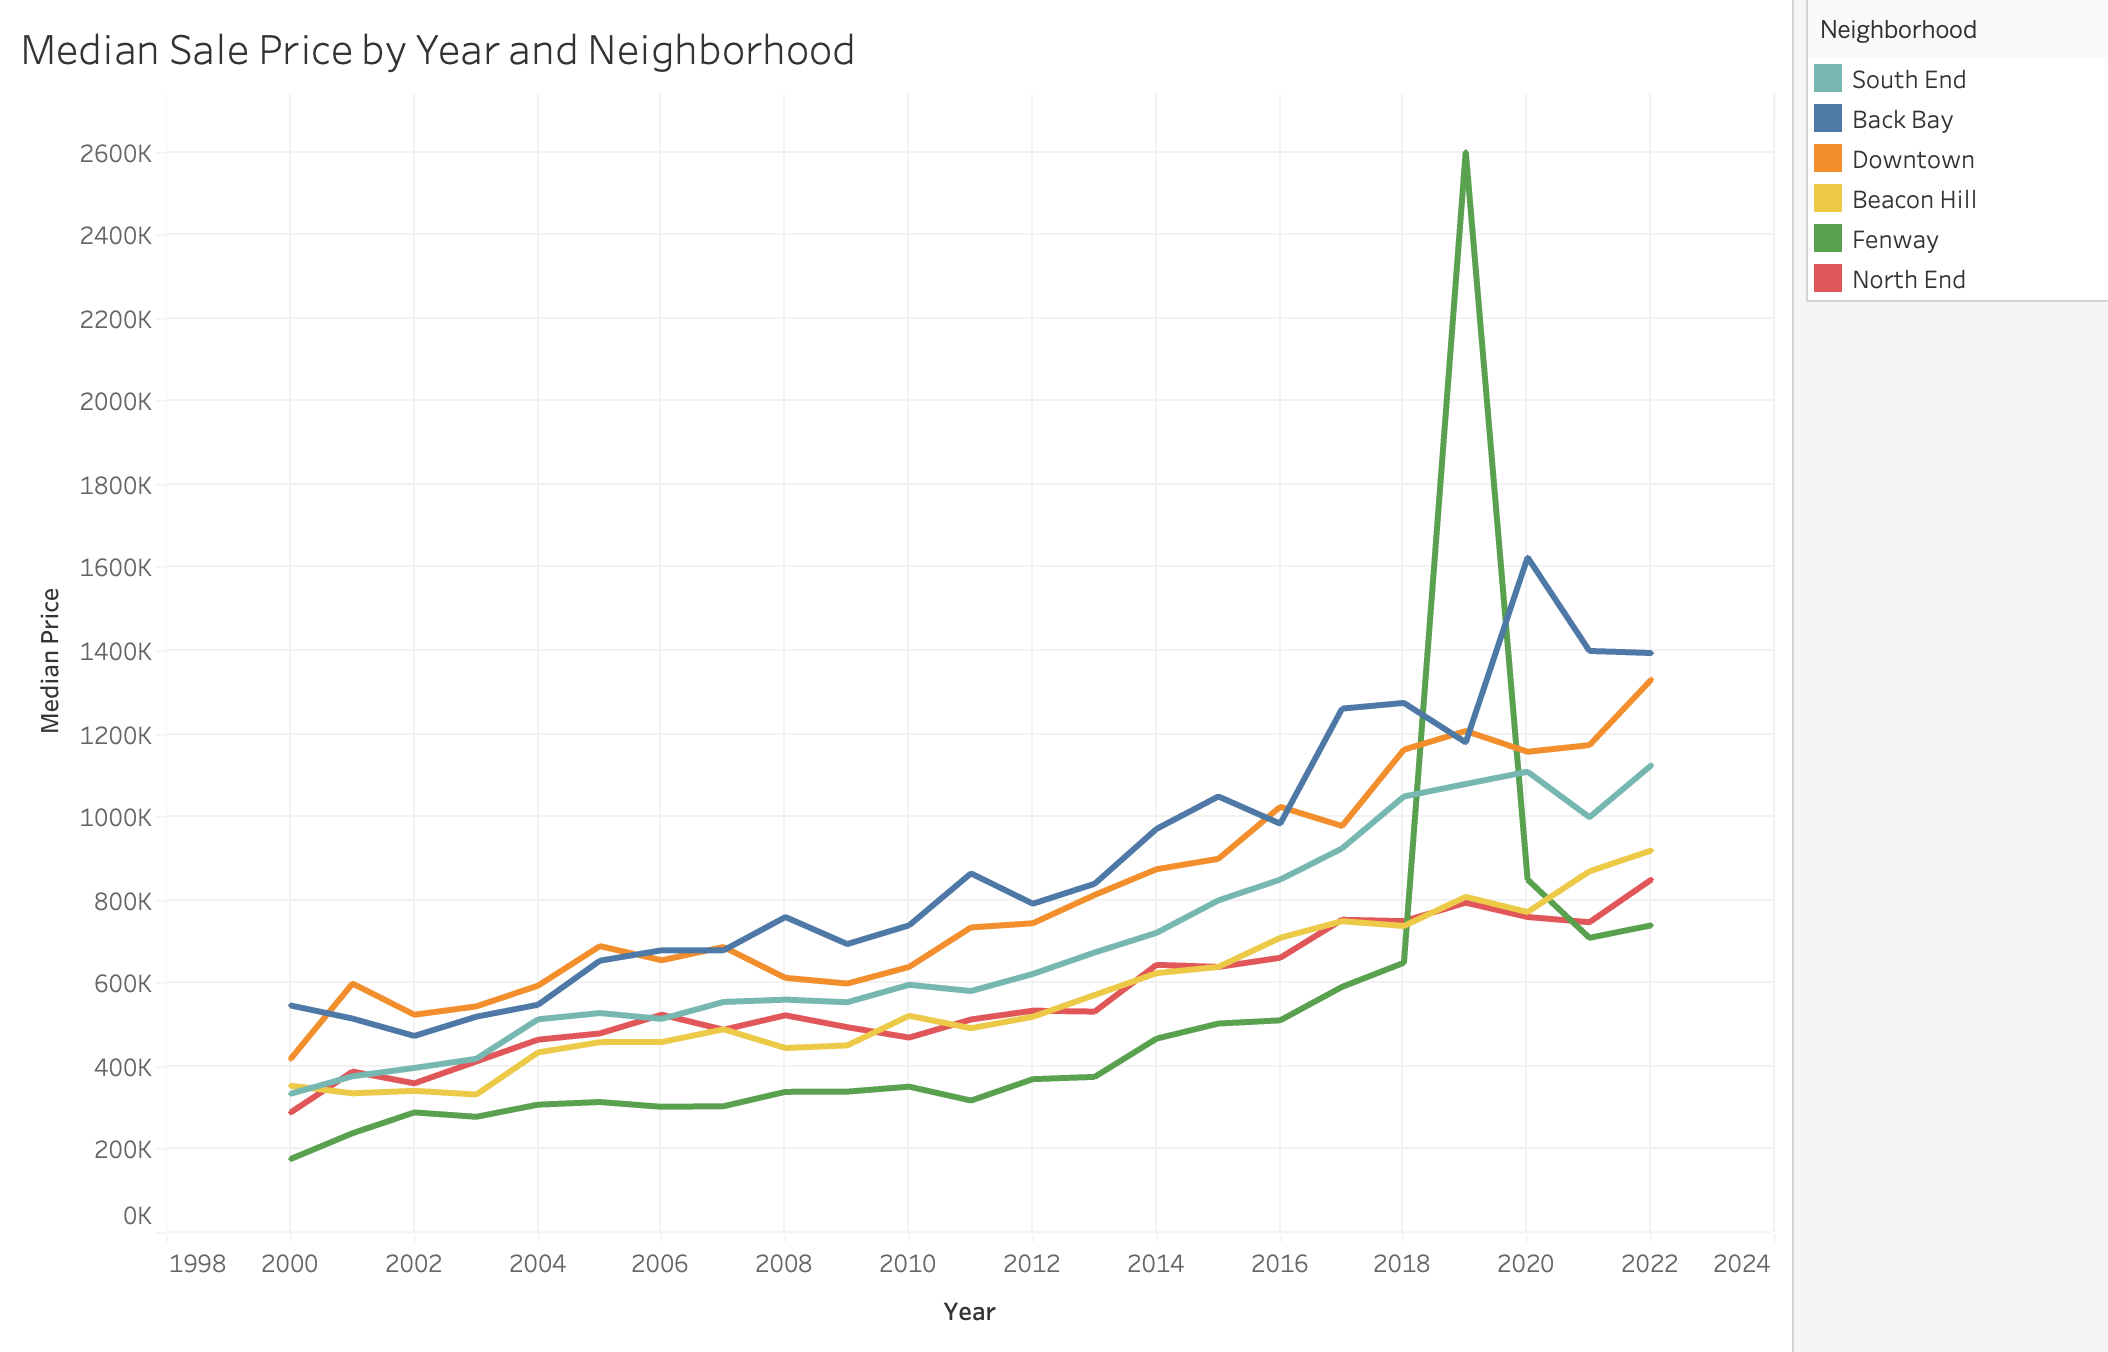
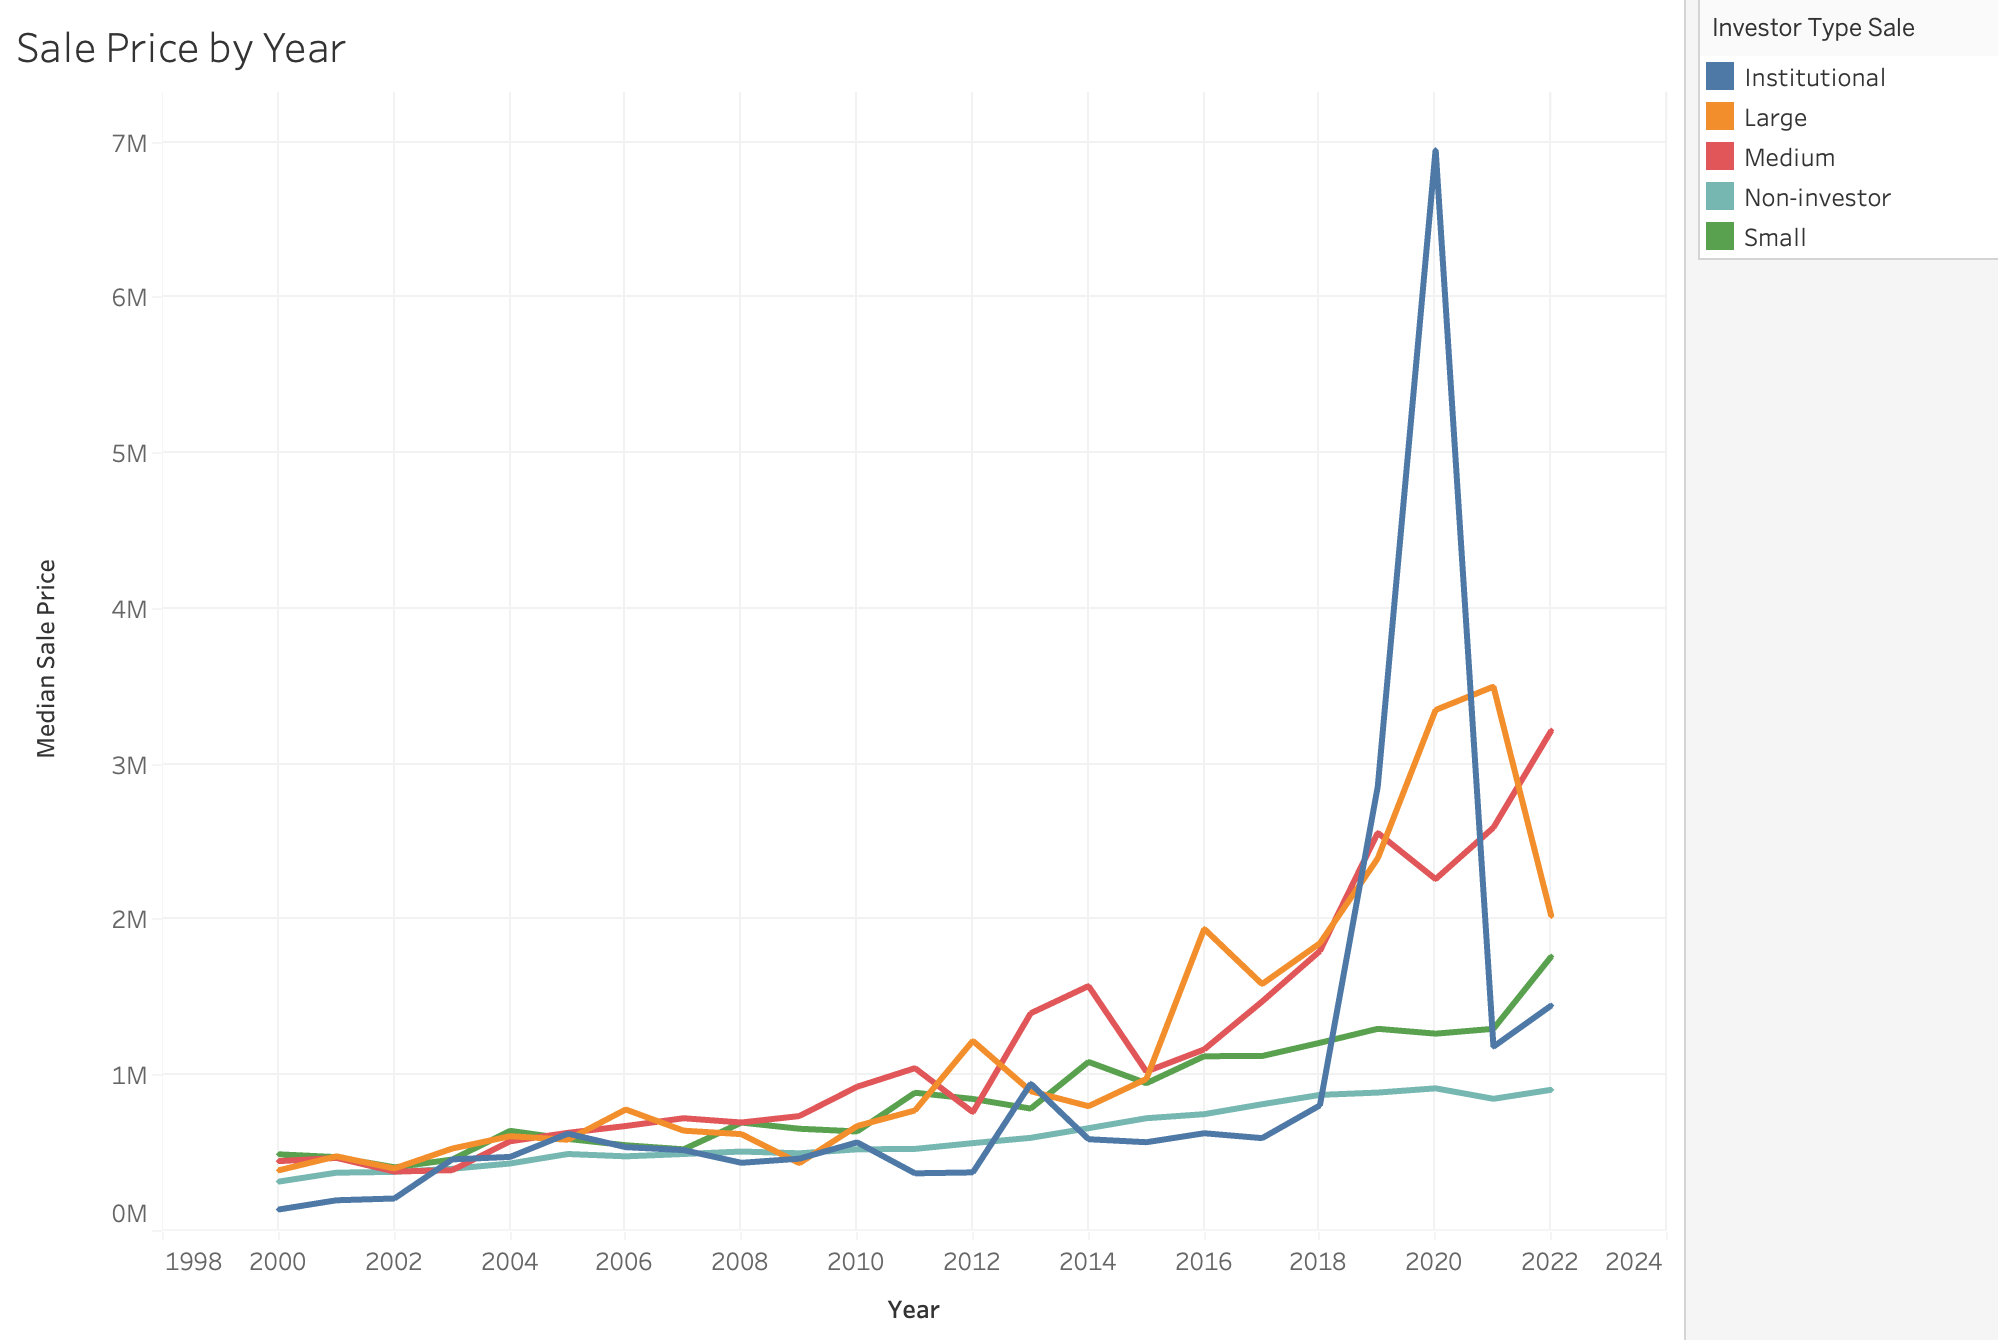
  1. How has the sale of residential properties changed over the time period, both in terms of sale quantity and price?
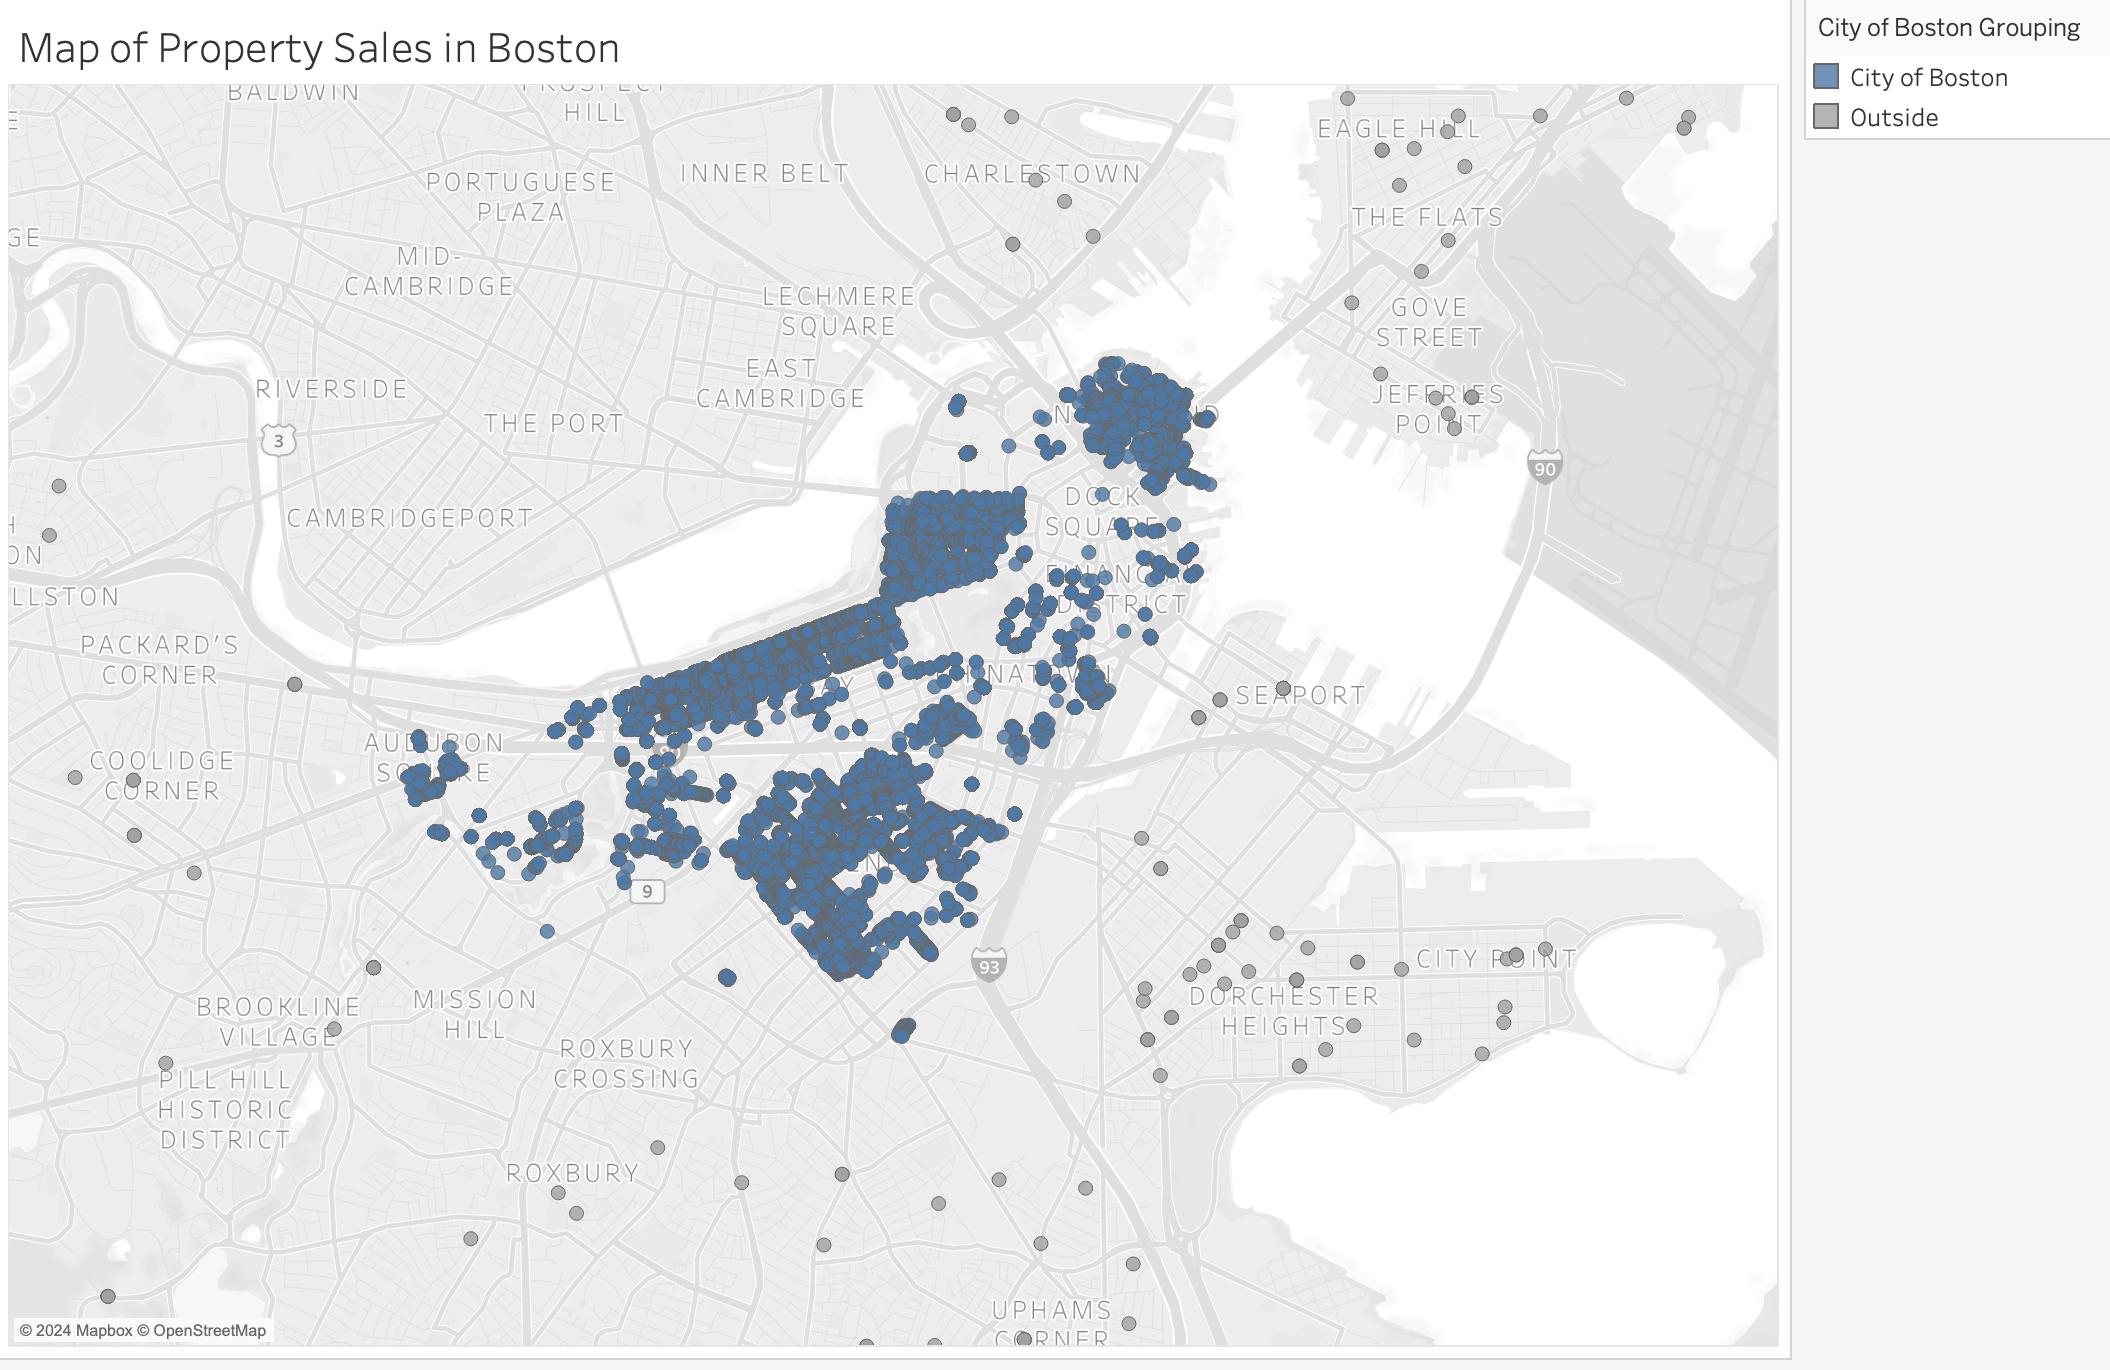
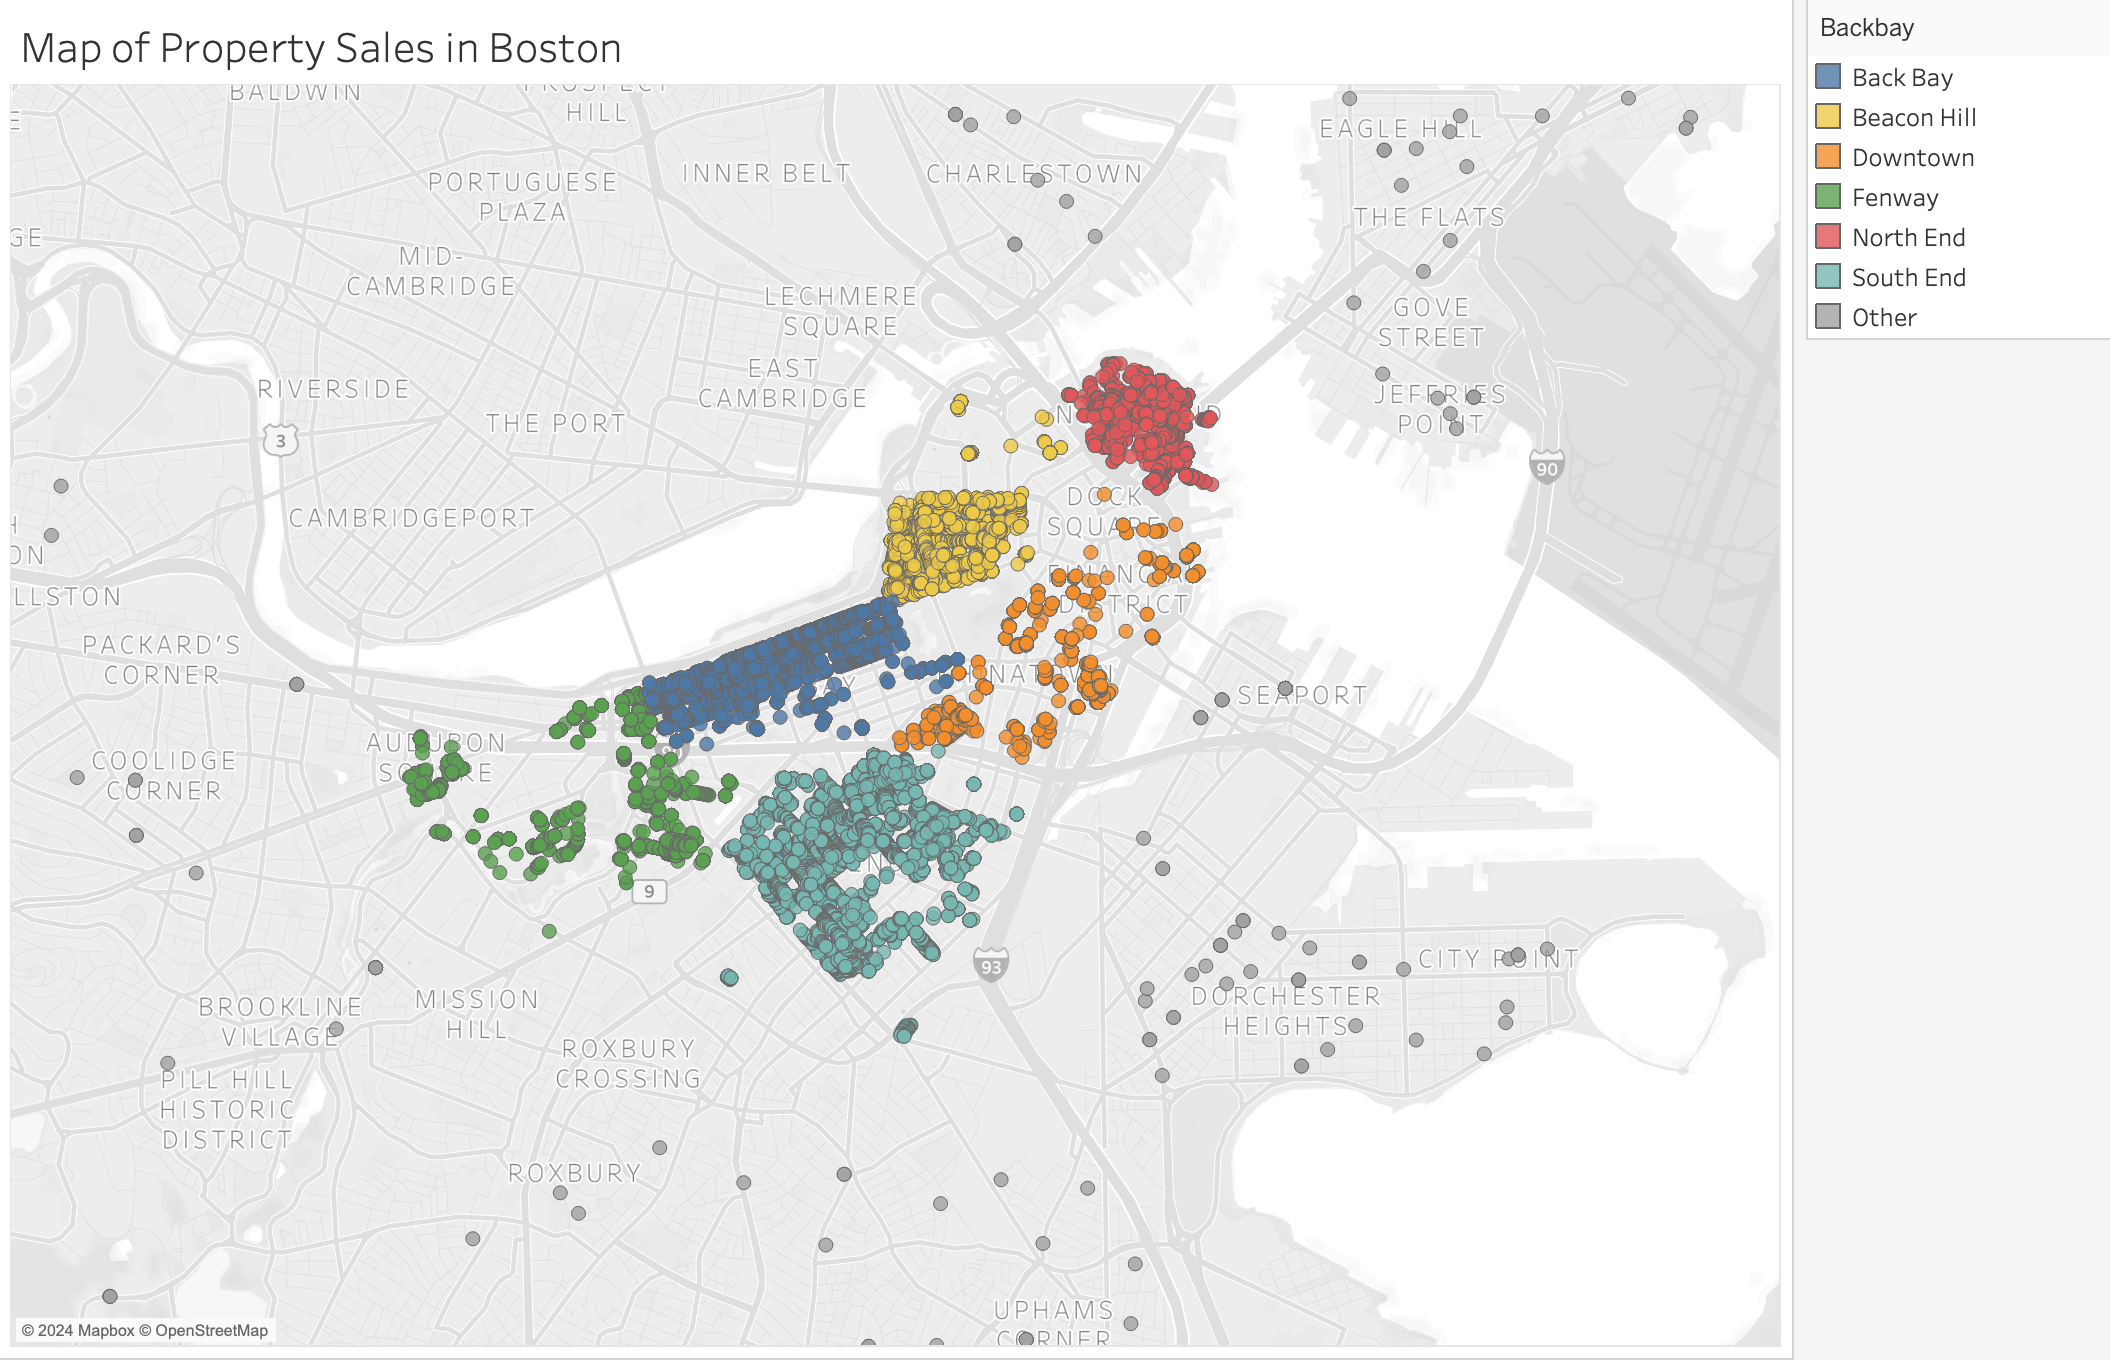
  2. What is the spatial distribution of sales in Boston?
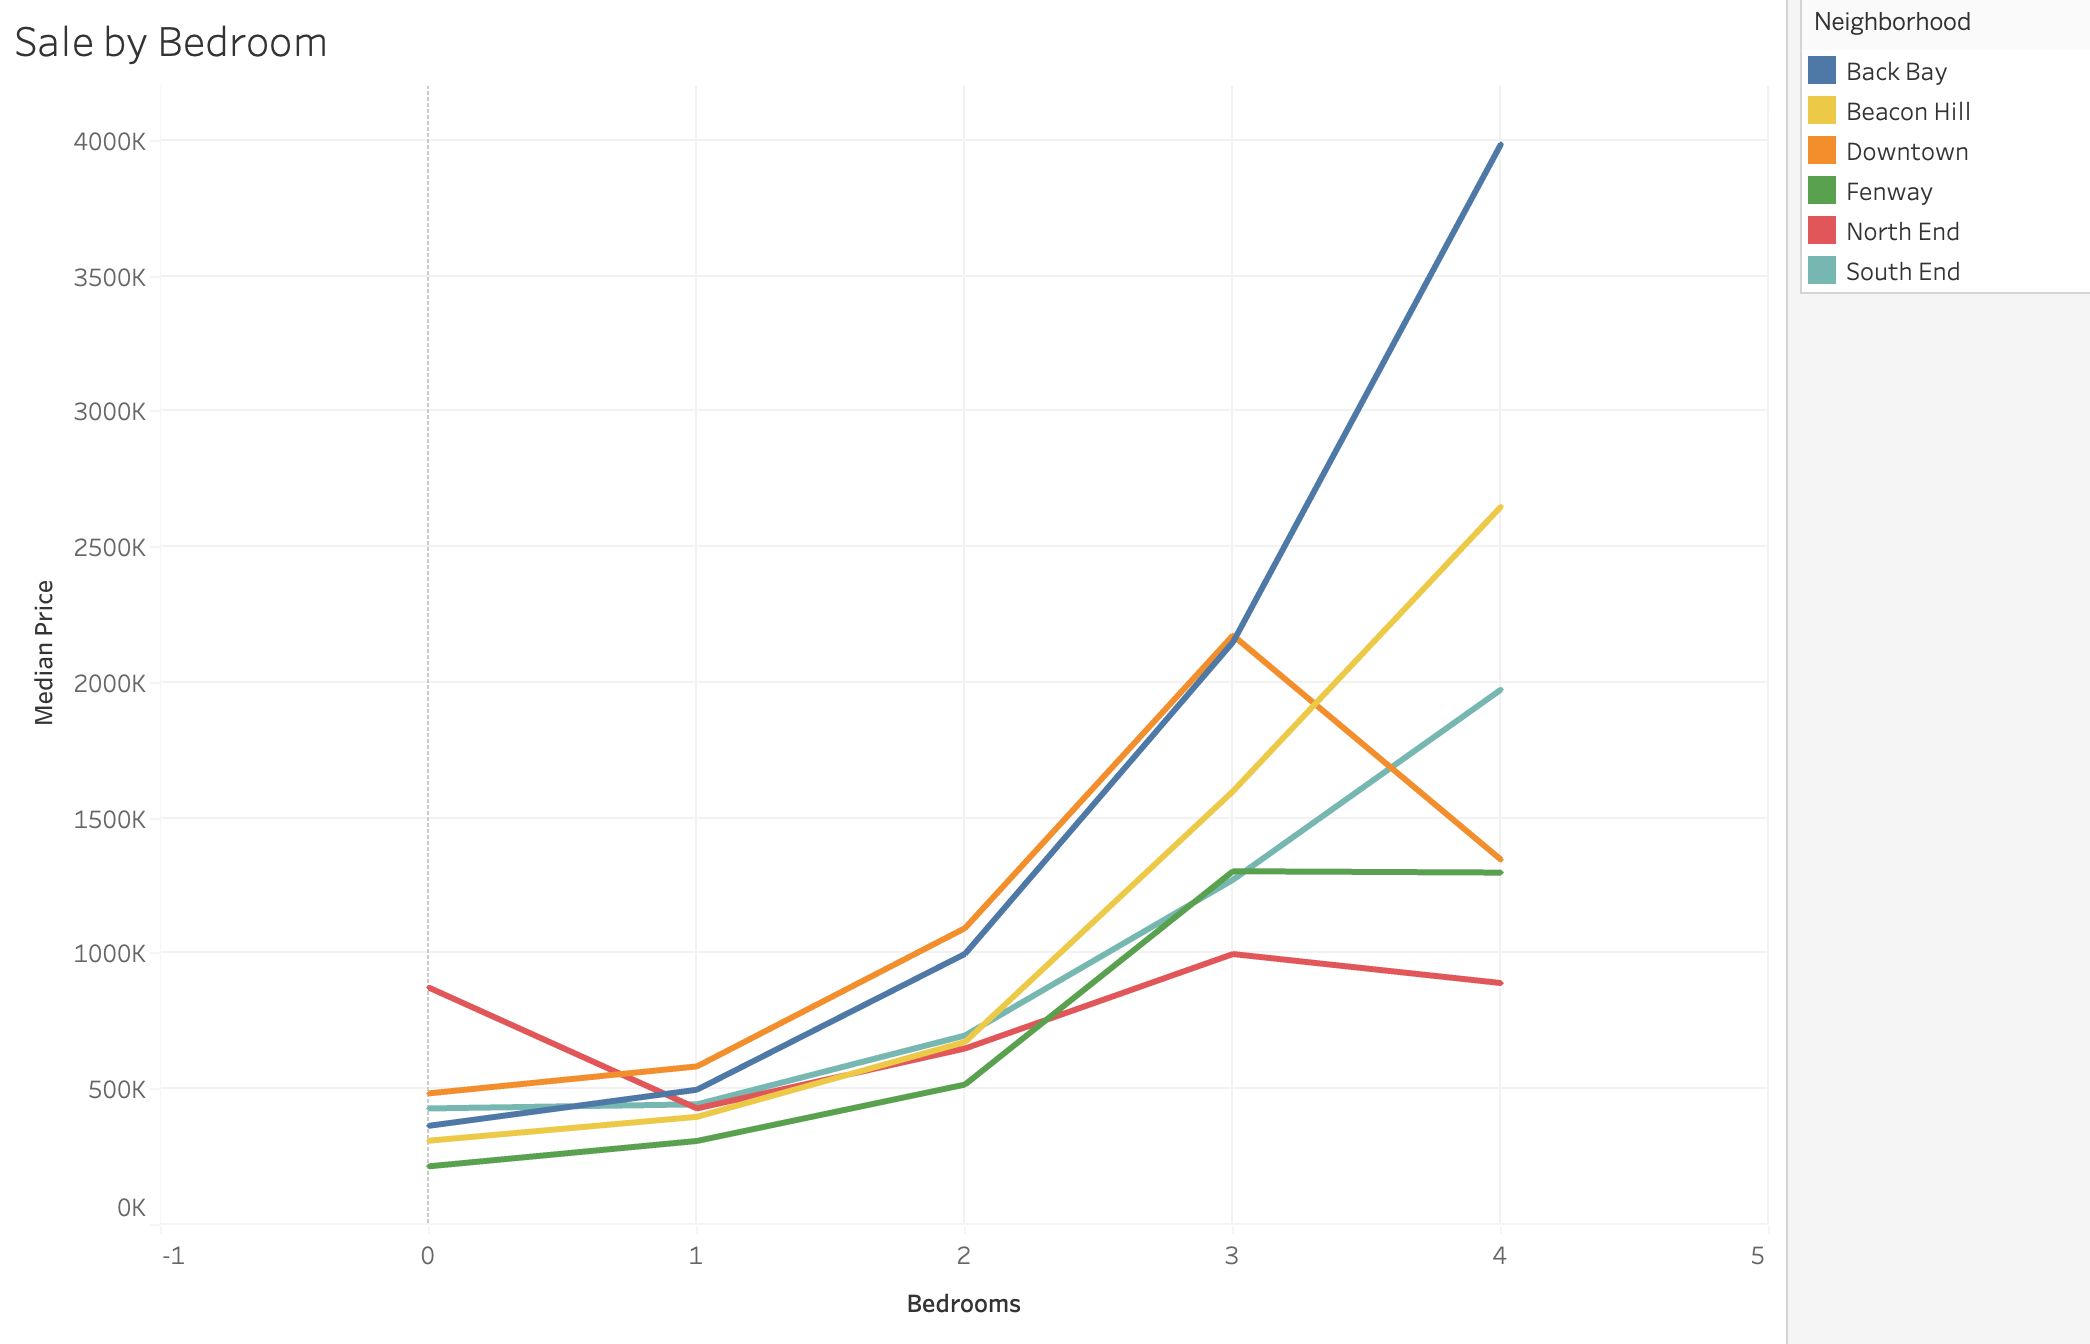
  3. What factors drive residential property prices in Boston?
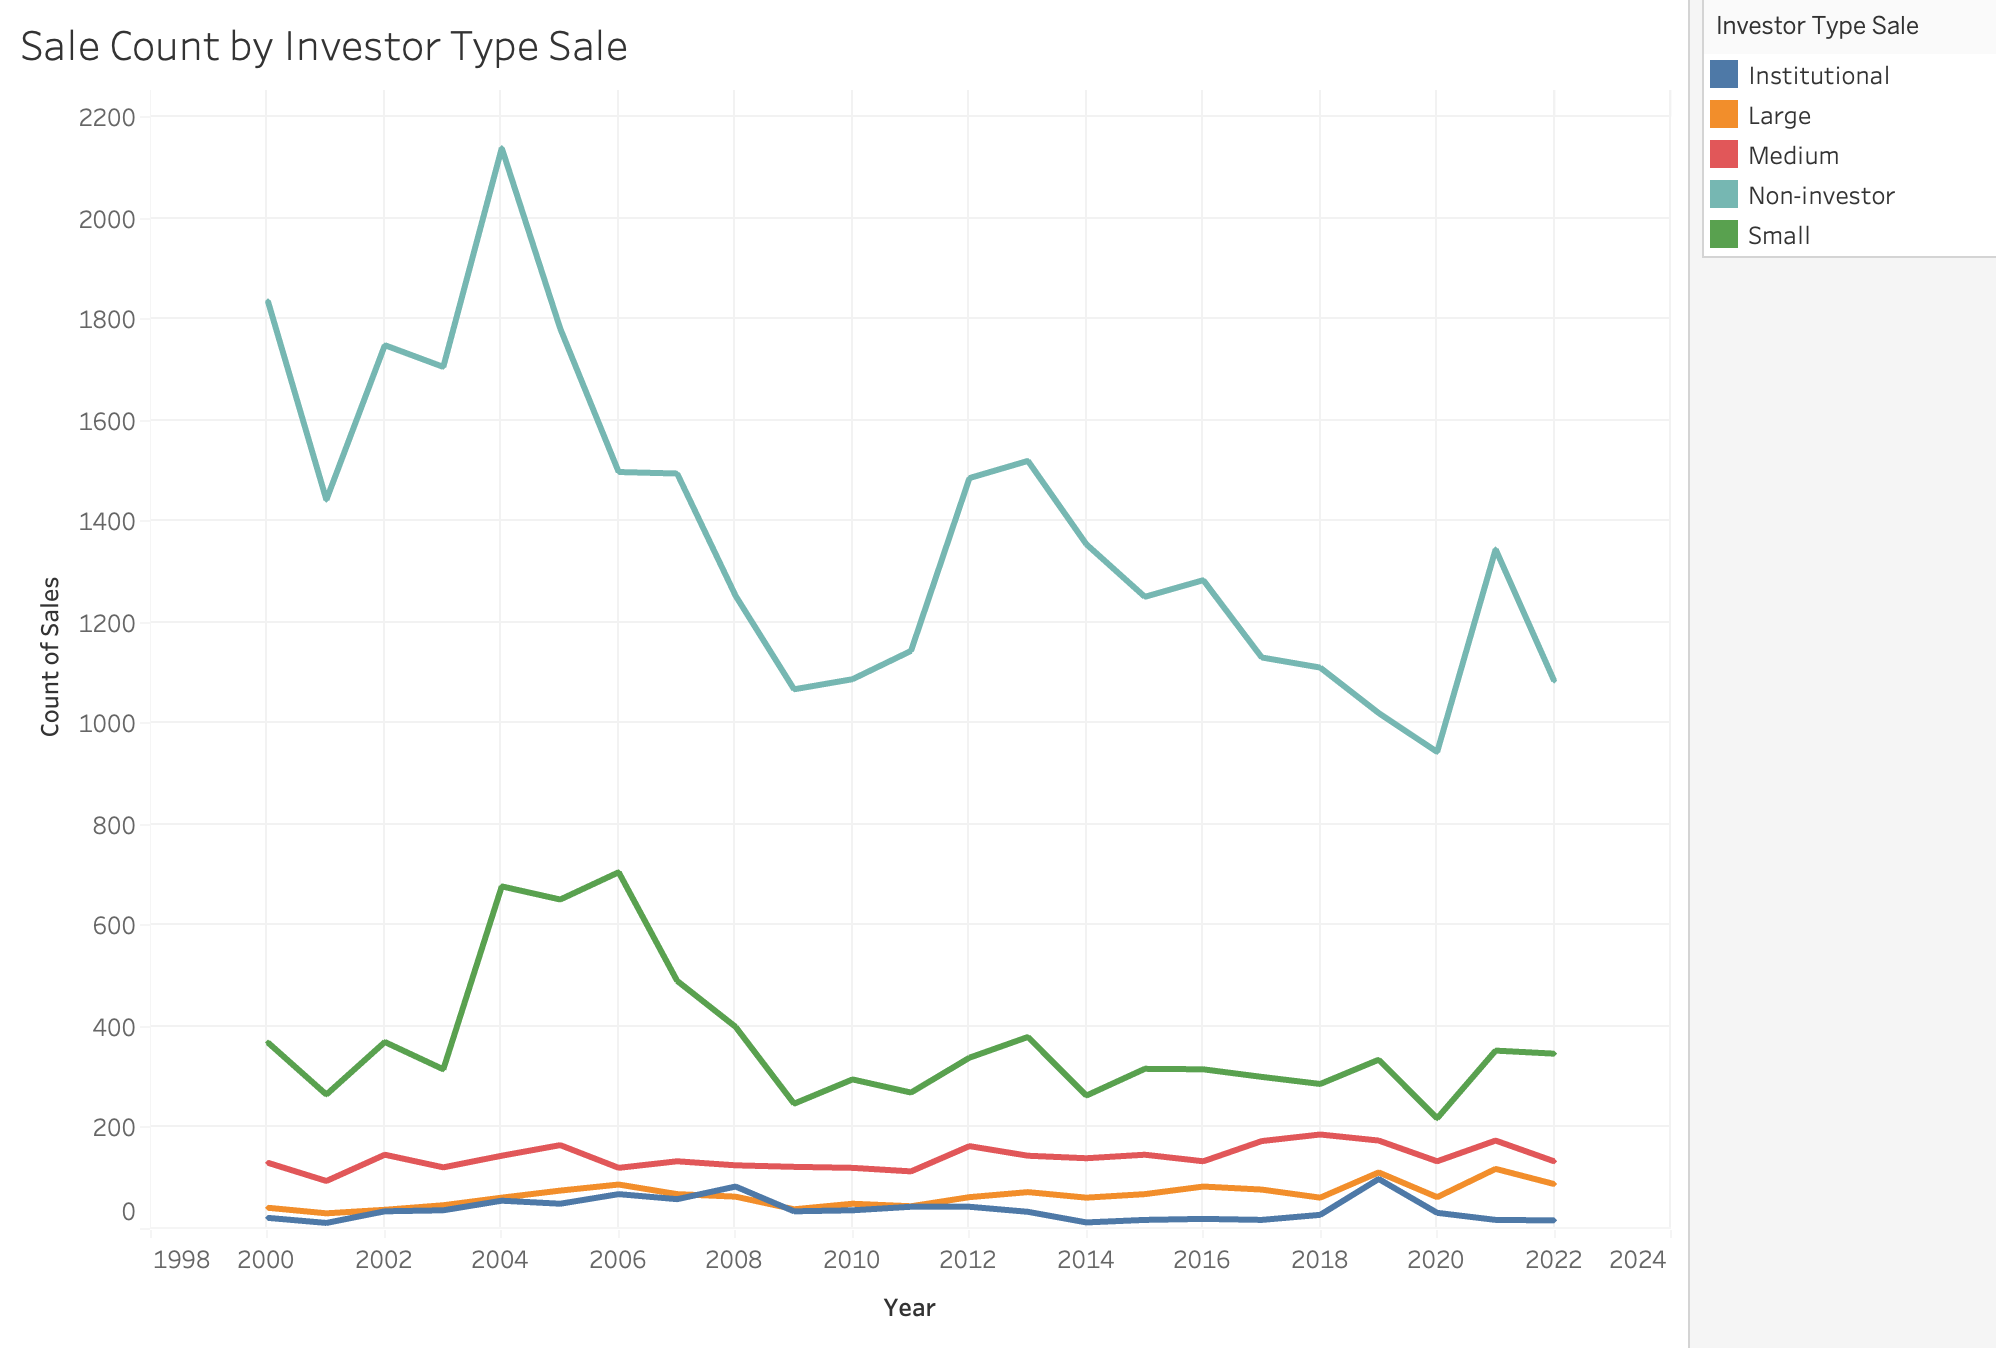
  4. Has there been an increasing investor activity?

Initial Data Overview & Filtering

This bar chart shows the summary of sales data collected by year. The dataset comprises just over 49,300 total sales from 2000 through 2022. The figure shows an overall downward trend in the number of sales. There was a greater number of sales before the housing crisis in 2007, with the peak number of sales (over 3,000) occurring in 2005. There was a substantial dip in sales in 2009 (around 1,500), followed by a moderate recovery starting in 2012. Finally, there is another apparent dip in sales during the COVID pandemic in 2020, followed by a subsequent recovery in 2021.
Next, I begin investigating some of the more helpful classifiers in the dataset, the most distinctive being "usage." This horizontal bar chart shows the sale count by usage. The greatest number of sales is condominiums. Looking at the rest of the usage classifiers and cross-examining them with meta-data, it is easy to see that many of these sales do not qualify as typical "residential" sales. For example, the data includes the sale of parking lots, gas stations, office space, commercial land, and restaurants. The subsequent analyses filter the data only to show the following usage categories: condominiums, 1-family residences, 2-family residences, 3-family residences, and "Apartment Buildings" (4+ units).
Finally, it is prudent to look at the sales locations. An initial map of sales points is shown in this figure using the latitude and longitude coordinates from the dataset. While most of the data points center around Boston, a few outliers exist in Boston's suburbs. Some outliers are misclassified coordinate data (for example, one point had Fanuel Hall well outside city limits); however, many are not. The outliers will be filtered out to ensure conclusions are based on sales within Boston. The blue dots represent sales within the City of Boston. The gray dots represent sales filtered from the subsequent data analysis.

Discoveries & Insights

After filtering the data, I may begin investigating question 1 on Boston housing sales trends in terms of quantity and price. Figure 1, despite being unfiltered, represents the sale quantity of Boston well and thus will not be regenerated in this report. The figure above shows some new information: median sale price by year. The figure shows over a 3-fold increase in median price over the time period! This is well beyond what would be expected from inflation. It should also be noted that sale price generally shows a stable increase- there isn't much noise in the trend. Its surprising that not even the 2007 economic crisis can be seen Boston housing prices!
"Location, Location, Location" is the mantra of many real estate agents. To effectively answer question 2 (regarding the spatial distrobution of sales), it is essential to classify sales by location. I broke down the sales into seven neighborhoods: Back Bay, Beacon Hill, Downtown, Fenway, North End, South End, and Other (Other being filtered out). (Neighorbood source: http://www.bostonpedicab.com/neighborhoods)
Next, I may readdress question 1 (regarding the number of sales) in light of Boston neighborhoods. This chart shows the number of sales by neighborhood and year. Back Bay and South End show significant drops in sales at -48% and -28%, respectively. Beacon Hill, Fenway, and North End expereince some shrinkage in sale volume, but the change is not as meaningful. Downtown is the odd one out, actually showing an +50% increase in sales. All neighborhoods show meaningful variation in sales count from year to year.
Similarly, this chart details the median sale prices by neighborhood and year. It also begins to address qeustion 3: what factors drive residential property prices? Back Bay takes the prize for most expensive residential sales, followed by Downtown, South End, Beacon Hill, North End, and finally Fenway. Regarding pricing trends, the median sale price is significantly growing in all neighborhoods. Some economic dynamics may be at play within Boston: the housing supply is decreasing, resulting in a corresponding price increase. Also noteworthy is the median price outlier for Fenway 2019. This point is worth further investigation and could be an interesting case study in the future.
The number of bedrooms is also a driving factor in sale price. There is a general positive corellation between number of bedrooms and sale price. Similar trends may be seen with interior square footage.
To address the final question on investor activty, this figure shows investor sale count by year. Non-investors make the bulk of the sales each year, but purchase activity within this segment clearly decreases over the period. Small, Medium, Large, and Institutional investors show less of a trend, but hold relatively stready throughout each year. As the total number of sales is decreasing, this means that a greater proportion of sales are being generated through investor activity. Investor purchase activity paints a similar picture: non-investor sale counts are decreasing, while investor sales counts remain firm.
Similar to the previous figure, this figure shows sale price by year, segmented by investor activity. All segments show meaningful price increases. However, large and medium type investors show a greater amount of growth showing 5 and 7 fold increases respectively.

Summary

Based on the comprehensive analysis presented in your assignment on exploratory data analysis of Boston's housing market, it is evident that the city's real estate dynamics have undergone significant changes over the analyzed period. The data reveals a notable increase in median sale prices, far outpacing inflation, with particular neighborhoods like Back Bay and Downtown commanding the highest values. This trend is coupled with a decreasing sales volume, suggesting a tightening market. Moreover, the decreasing role of non-investor activity highlights a shift towards more investment-driven market dynamics. This initial analysis provides a solid foundation for understanding Boston's housing landscape, laying the groundwork for future studies and analysis.

Sources

Ostriker, Rebecca. “Luxury Condo Building Boom: Boston’s Towers of Wealth.” BostonGlobe.Com, Boston Globe, 1 Nov. 2023, apps.bostonglobe.com/2023/10/special-projects/spotlight-boston-housing/boston-towers-of-wealth/.

“Speculation and Investment in Greater Boston.” homesforprofit.Com, Homes for Profit, 2022, https://homesforprofit.mapc.org/report.

AI was used to correct grammer, spelling, and to help write the conclusion